The following are some key considerations when it comes to data visualization:
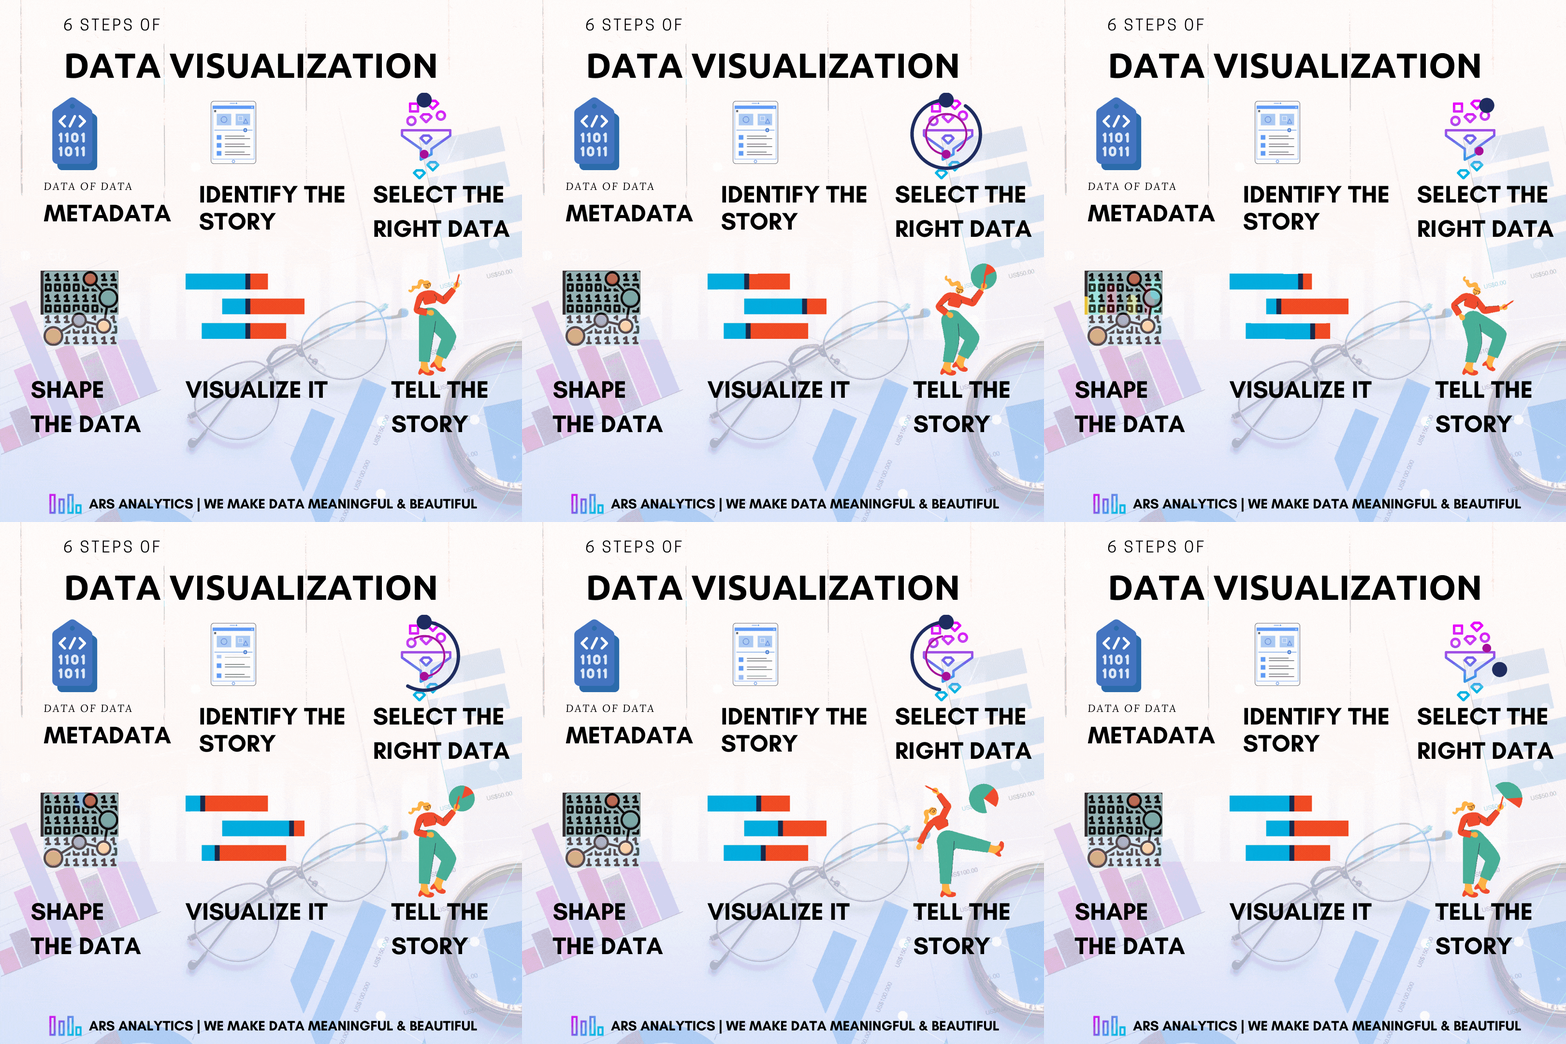
1. Metadata: This includes the following data fields: the data source, the data type, the time period, and the geographical region. Metadata will help to organize and understand the data.
2. Identify the story you want to tell: Data visualization should be used to tell stories about data; this will make your visualization clear and compelling.
3. Select the right data
4. Shape the data:
5. Visualize it:
6. Tell the story

.png)
